The Warehouse Inventory table populates inventory quantities for each Item within each Warehouse. The inventory quantities available to view reflect those in the “Inventory Level” and “Inventory Status” quantities on Item records. This allows users to filter and drive reports based on inventory within specific Warehouses, LOBs, and SKUs. Quantities in this table are updated every time inventory quantities are adjusted - including added to orders, ASNs are created, inventory is received, Cycle Counts are done resulting in adjusted inventory, orders begin fulfillment, etc.
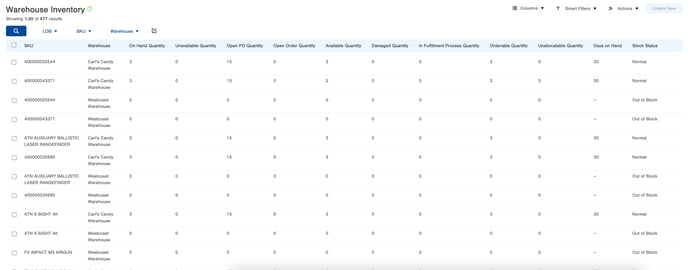
Here is an example of what the Warehouse Inventory table looks like:
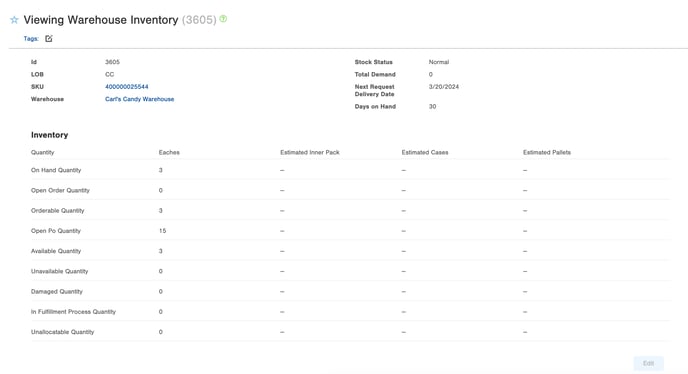
And here is an example of what a Warehouse Inventory record looks like:
Here is a description of the quantities available to view, and how they are calculated:
|
Quantity Field |
Description |
|
On Hand Quantity |
Any product on hand, regardless of status or location |
|
Open PO Quantity |
Quantity within open Item Receipts |
|
Available Quantity |
Quantity with “Available” statuses within both Item Receipt and Locations |
|
Unavailable Quantity |
Quantity with one of the following conditions:
|
|
Damaged Quantity |
Quantity with a “Damaged” status |
|
Unallocatable Quantity |
Quantity that has one of these conditions:
|
|
In Fulfillment Process Quantity |
Quantity allocated to incomplete Fulfillment Processes |
|
Open Order Quantity |
Quantity requested by Orders that have not been through Fulfillment |
|
Total Demand |
Sum of direct demand (Open Order Quantity) and indirect demand (KODs, Dynamic Kits, and Substitutions) |
The above quantities can also be viewed by Quantity per Case, Quantity per Inner Pack, and Quantity per Pallet, if these are defined on the Item’s record.
Accessing the Warehouse Inventory Table
There are two ways to access the Warehouse Inventory table:
- From the Dashboard: Click the “Warehouse Operations” tab, click the “Inventory Management” App, then click the “Warehouse Inventory” table.
- From the Quick Actions shortcut: Press the dot (period) on your keyboard, then select “Warehouse Inventory” from the list of Quick Actions.
Viewing and Utilizing Information in the Warehouse Inventory Table
Some of the ways to filter and utilize the information contained within the Warehouse Inventory table include:
- Adding columns using the “Columns” button and selecting each field you would like to view. See Show/Hide Columns.
- Searching for specific information using the “Search” fields above the table. See Search Within Tables.
- Saving search criteria as Smart Filters by clicking the “Smart Filters” button. See Create Smart Filters.
- Creating User Reports driven on Smart Filters by accessing the “Manage User Reports” table.
Note: Due to the Warehouse Inventory table being read-only, Triggers cannot be used on it.
- As an example, consider if you wanted to create a User Report displaying quantities of all SKUs for a specific LOB within a specific Warehouse.
- First, you would filter by the LOB and Warehouse you wish to drive the report off of, by selecting them in the “LOB” and “Warehouse” dropdowns above the table.
- Then, you would ensure all columns you wish to include are selected using the “Columns” dropdown.
- Once you have the table filtered and columns added to your liking, you can save the template as a Smart Filter by selecting the “Smart Filters” dropdown, clicking “Save,” and naming your filter.
- Finally, navigate to the “Manage User Reports” table, clicking “Create New,” and selecting “Data Report” or “Pivot Report,” depending on your needs. After clicking “Next,” you can then select the Smart Filter you just created, name your User Report, include if you want Header and Footer rows, add or remove columns, and even add a Script if you wish by selecting the “Advanced” dropdown.
After saving the report, you can run it anytime by selecting the arrows to the right of it and clicking “Run Report.” Here is an example of what this Warehouse Inventory report looks like, containing all quantities for a specific LOB within a specific Warehouse:
Accessing Warehouse Inventory Records via API
You may also access records within the Warehouse Inventory via the warehouseInventory API endpoint.
Here is an example of a GET request to retrieve a specific record (with id=1) within the Warehouse Inventory table via API:
GET https://[subdomain].infopluswms.com/infoplus-wms/api/v3.0/warehouseInventory/1
HTTP/1.1
API-Key: [YOUR_API_KEY]
Content-Type: application/json; charset=utf-8
This GET request would return information such as the SKU, Line of Business, Warehouse, and all quantities associated with that SKU within that Warehouse.
The methods available for use with this endpoint, along with examples of the response schemas and bodies, may be found within the Infoplus API documentation.