You can use data in the Order Line table of Infoplus to create a pivot table (in Excel, Google Docs, or another spreadsheet application) to understand the velocity of the items in your inventory. Here's an overview of the process, which you can customize as you need it:
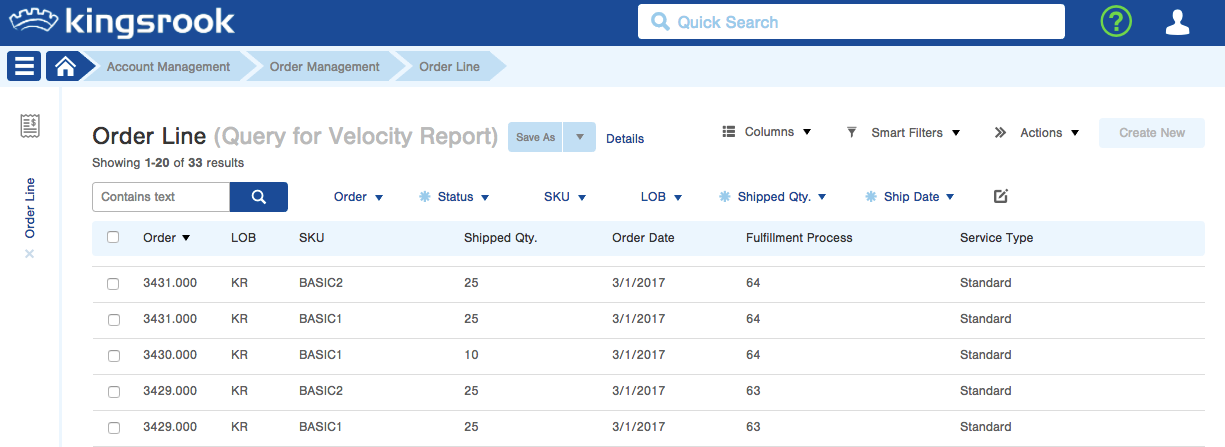
- First, in Infoplus, run a query on the Order Line table:
- For query criteria, we recommend:
- Warehouse (if you are running more than one)
- Status (Processed & Shipped)
- Shipped Quantity greater than 0
- Include as a starting point these columns:
- Order
- LOB
- SKU
- Shipped Qty.
- Order Date
- Fulfillment Process
- Service Type
- Note: with that query, you'll need to adjust the Ship Date to cover a period that returns less than 10,000 rows, as that is the most you can export at any time today - you may need to perform multiple exports and manually copy and paste them into one spreadsheet for analysis.
- For query criteria, we recommend:
2. Then, open the Spreadsheet and build a Pivot Table:
-
- First, if you are looking at multiple Lines of Business (LOB's), you may find it best to add a new column into your sheet, where you combine the LOB & SKU fields into a single cell, for example, with a formula like: =B2&"-"&C2. We'll refer to that column as "LOB & SKU" for the rest of this article.
- Second, it is often useful to know the total number of times an Item was included in a Fulfillment Process (i.e., how many times you had to go pick the item), rather than just its total Shipped Quantity. To figure out this value, we suggest you add a column named "Unique Processes", with a formula like this for all rows: =IF(AND(E2=E1,G2=G1),0,1) (where E is the column with Fulfillment Process number, and G is the LOB & SKU formula column). Then, to make this formula compute as expected, make sure your file is sorted, using a custom sort, by Fulfillment Process, Then by LOB & SKU.
- Next, create a Pivot table using all of the data, with the following field setup:
- For Rows, use the LOB & SKU field suggested above.
- For Values, the following are recommended:
- Use Sum of Shipped Qty., to measure the total units picked for each item
- Use Sum of the Unique Processes column, to figure out how many processes included the item.
- You may also want to add some Filters to your pivot table if there are certain types of activity you want to exclude. Alternatively, this could have been done on the original query within Infoplus (however, it may be more useful to get all of the data into the spreadsheet, then to do filtering there, to avoid going back and forth between Infoplus and the spreadsheet).
- You may then want to copy the values out of the pivot table, into a table in a new worksheet, so that you can sort & filter them, using the standard spreadsheet functionality.
Here is a sample Excel file where we have set up the formulas and pivot table mentioned above:
OrderLine Velocity Pivot Table Example