Dashboard Overview:
There is a lot of important information that the dashboard can tell you. Most importantly, which environment you're currently working in. If you see the “Yellow Bar” at the top of the dashboard, you are in the TEST Environment. If there is no “Yellow Bar” you are in the Production Environment.
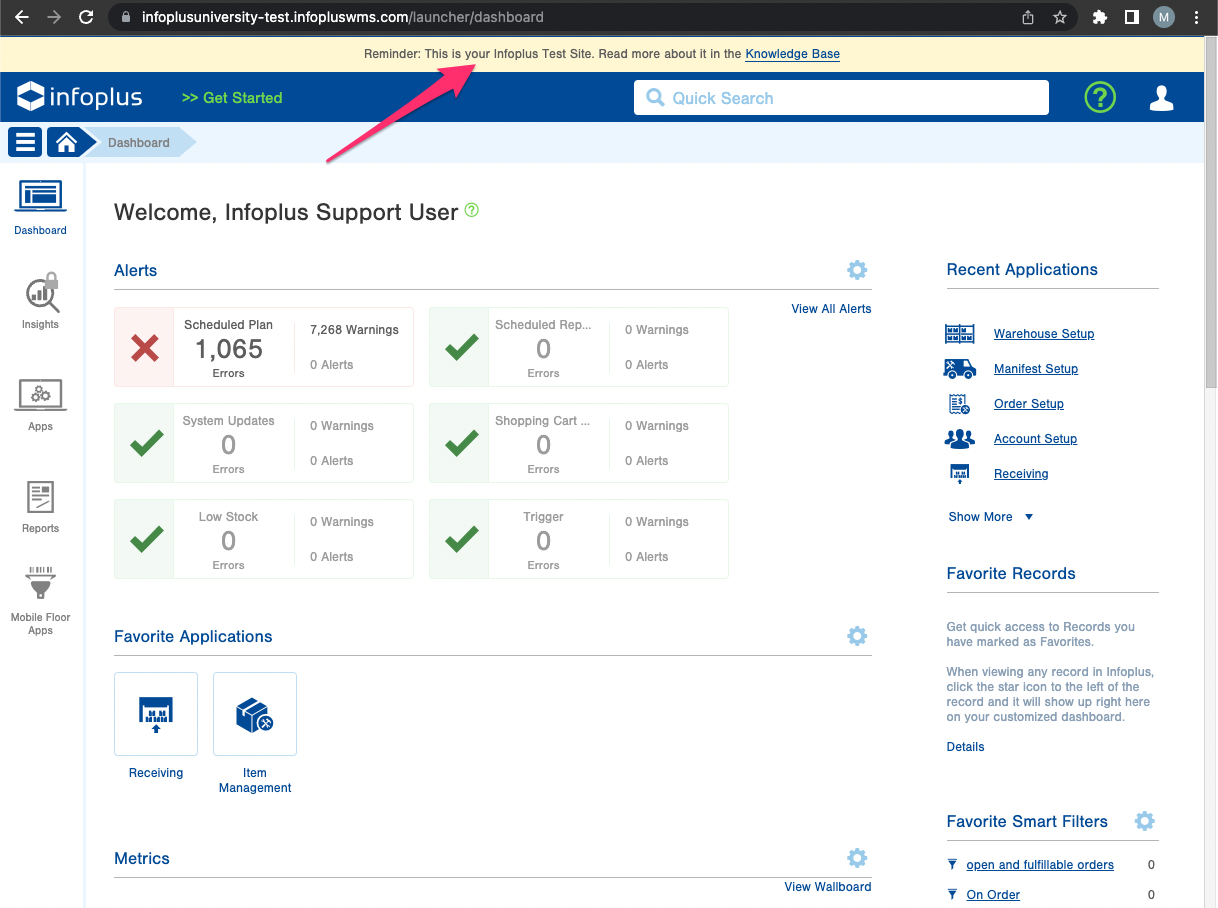
Dark Blue Bar Functions: From Left to Right
- Infoplus Icon - Back to the Dashboard
- >> Get Started - Knowledge-Based Articles
- “Quick Search” - Allows you to search any term within Infoplus
- Circled Question Mark - Knowledge-Based Articles
- User Icon - Profile, Settings, and Logout Screens
Light Blue Bar Functions: From Left to Right
- 3 Lines - Menu Functions
- Home Button - Back to the Dashboard
- Blue Arrow (Breadcrumbs) - Navigation bar for going back to previous screens
5 Icons to the left of the Dashboard:
- Dashboard Icon - Back to the Dashboard
- Insights page - To the Open Order Insights Page
- Apps page - All the Infoplus Apps
- Reports page - View all available reports
- Mobile Floor Apps - Classic and Modern Mobile Floor Apps Options
- Tooltips:
Tooltips are interactive Texts that, when clicked, display information to the user about the feature or field that it is near. Tooltips are colored Blue.
![]()
Customizable Output Panels:
The Static Panels on this page can be customized to show valuable information on critical functions within the warehouse.

Jump to sections:
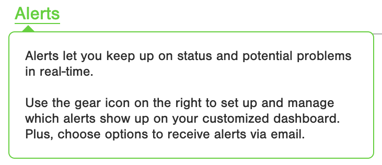
Alerts:
The first, and possibly the most important panel is the Alerts panel. Check out this link for configuring Alerts for your warehouse.
Adding Alerts categories to the Dashboard gives the user a high-level view of the issue and potential actions that might need to be addressed within the warehouse.
To add a new Alert to the Alert panel, click the  icon to the right of the Alerts title, then click the
 ![]() menu option.
menu option.
The following screen will allow different Alert types to be selected and added to the Alerts panel. The list to the left is all the available Alerts being tracked within the system.

The "Check Boxes" give users the option to select the alert level that generates a notification on the Dashboard. The following are the different Alert level options listed from Low to High.
Info:
Warning:
Error:
Each Category also has a "Summary" option that provides additional information to the user.
Favorite Applications:
Favorite Applications provide an icon that, once clicked takes the user to a specific feature or table. Most of Infoplus's features and tables are included in the extensive list of options. To access the panel options, click the to the right and then![]() menu option.
menu option.

Click the "Plus" and select from one of the many feature or table options.

Once selected, Click the "Add" button in the lower right corner.

Continue to click the "Plus" icon and then "Add" as many times as necessary until all the desired features or tables are added to the panel, then click "Done" in the low right corner.

Metrics:
The dashboard provides a quick view of your key metrics. You can add or remove any metrics that will help you understand your warehouse or employee performance. You can also click on any metrics on the dashboard to see detailed results.
 Here are some examples of common metrics Infoplus users have on their dashboards:
- Backorders
- Open Work Tickets
- Open Orders
- Orders Shipped in Last __ Hours

NOTE: To see a Wallboard view of your metrics (full-screen view), click the View Wallboard link. See View Metrics as a Wallboard for more information.
You can personalize and create these metrics specifically for your business needs. They are entirely customizable and can pull any data from within Infoplus. Then, you can set parameters so the metric can alert you when it is in a 'good', 'bad', or 'neutral' state (per your standards).
Pro Tip: Metrics are set up on a user-by-user basis. This means if User A is logged in and sets up their metrics on the dashboard, Person B will not see those same metrics and will need to set the same metrics on their dashboard as well (if they want the same one).
How to Add a New Metric
- On the dashboard, find the Metrics section. Click the gear icon and select Manage Metrics.
- Scroll to the bottom of any existing metrics and click the plus sign.
- Select from Pre-Built metrics (if available) or click Custom to create your own metrics.
- For custom metrics, select the type of metric you want to create (i.e., "Single Value").
- Click Next.
- You will be prompted to make selections based on the type of metric you selected. For example, if you selected the "Single Value" metric you will need to select the Smart Filter to be used in the metric.
Here are the options available for custom metrics:
- Once you have made all your selections, click Add. The metric appears in the Metrics section on the dashboard.
- Click Done.
How to Rearrange Metrics on the Dashboard
- Within the Metrics section of the dashboard, click the gear icon and select Manage Metrics.
- Click and drag the metrics into the proper order.
- Click Done.
How to Delete a Metric
- Within the Metrics section of the dashboard, click the gear icon and select Manage Metrics.
- Click the next to the metric and select Delete. The metric no longer appears in the Metrics section.
Favorite User Report:

To add a new Favorite User Report click the icon to the right of the, then click the![]() menu option.
menu option.
The Manage User Reports window appears displaying all of your user reports. Here's an example: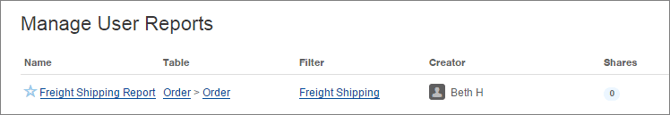
Click the white star (![]() ) to the left of the report that you want to make a favorite. The star icon changes to a blue star (
) to the left of the report that you want to make a favorite. The star icon changes to a blue star (![]() ). The report is now accessible from the Favorite Reports section of the Dashboard and the report's related App.
). The report is now accessible from the Favorite Reports section of the Dashboard and the report's related App.
NOTE: If you want to remove the report from being a favorite, click the star again.
Tags:

Tags are a great way to flag specific data and are a foundational element of marking records for special notice. Script or Trigger can add Tags to records or Scripts and Triggers can be activated based on a Tag being added to a record. Check out this Link on how to use Tags